Emergency medical services calls
Figure: Greater Sudbury Paramedic Services calls for suspected opioid-related incidents, by month, 2018–2025
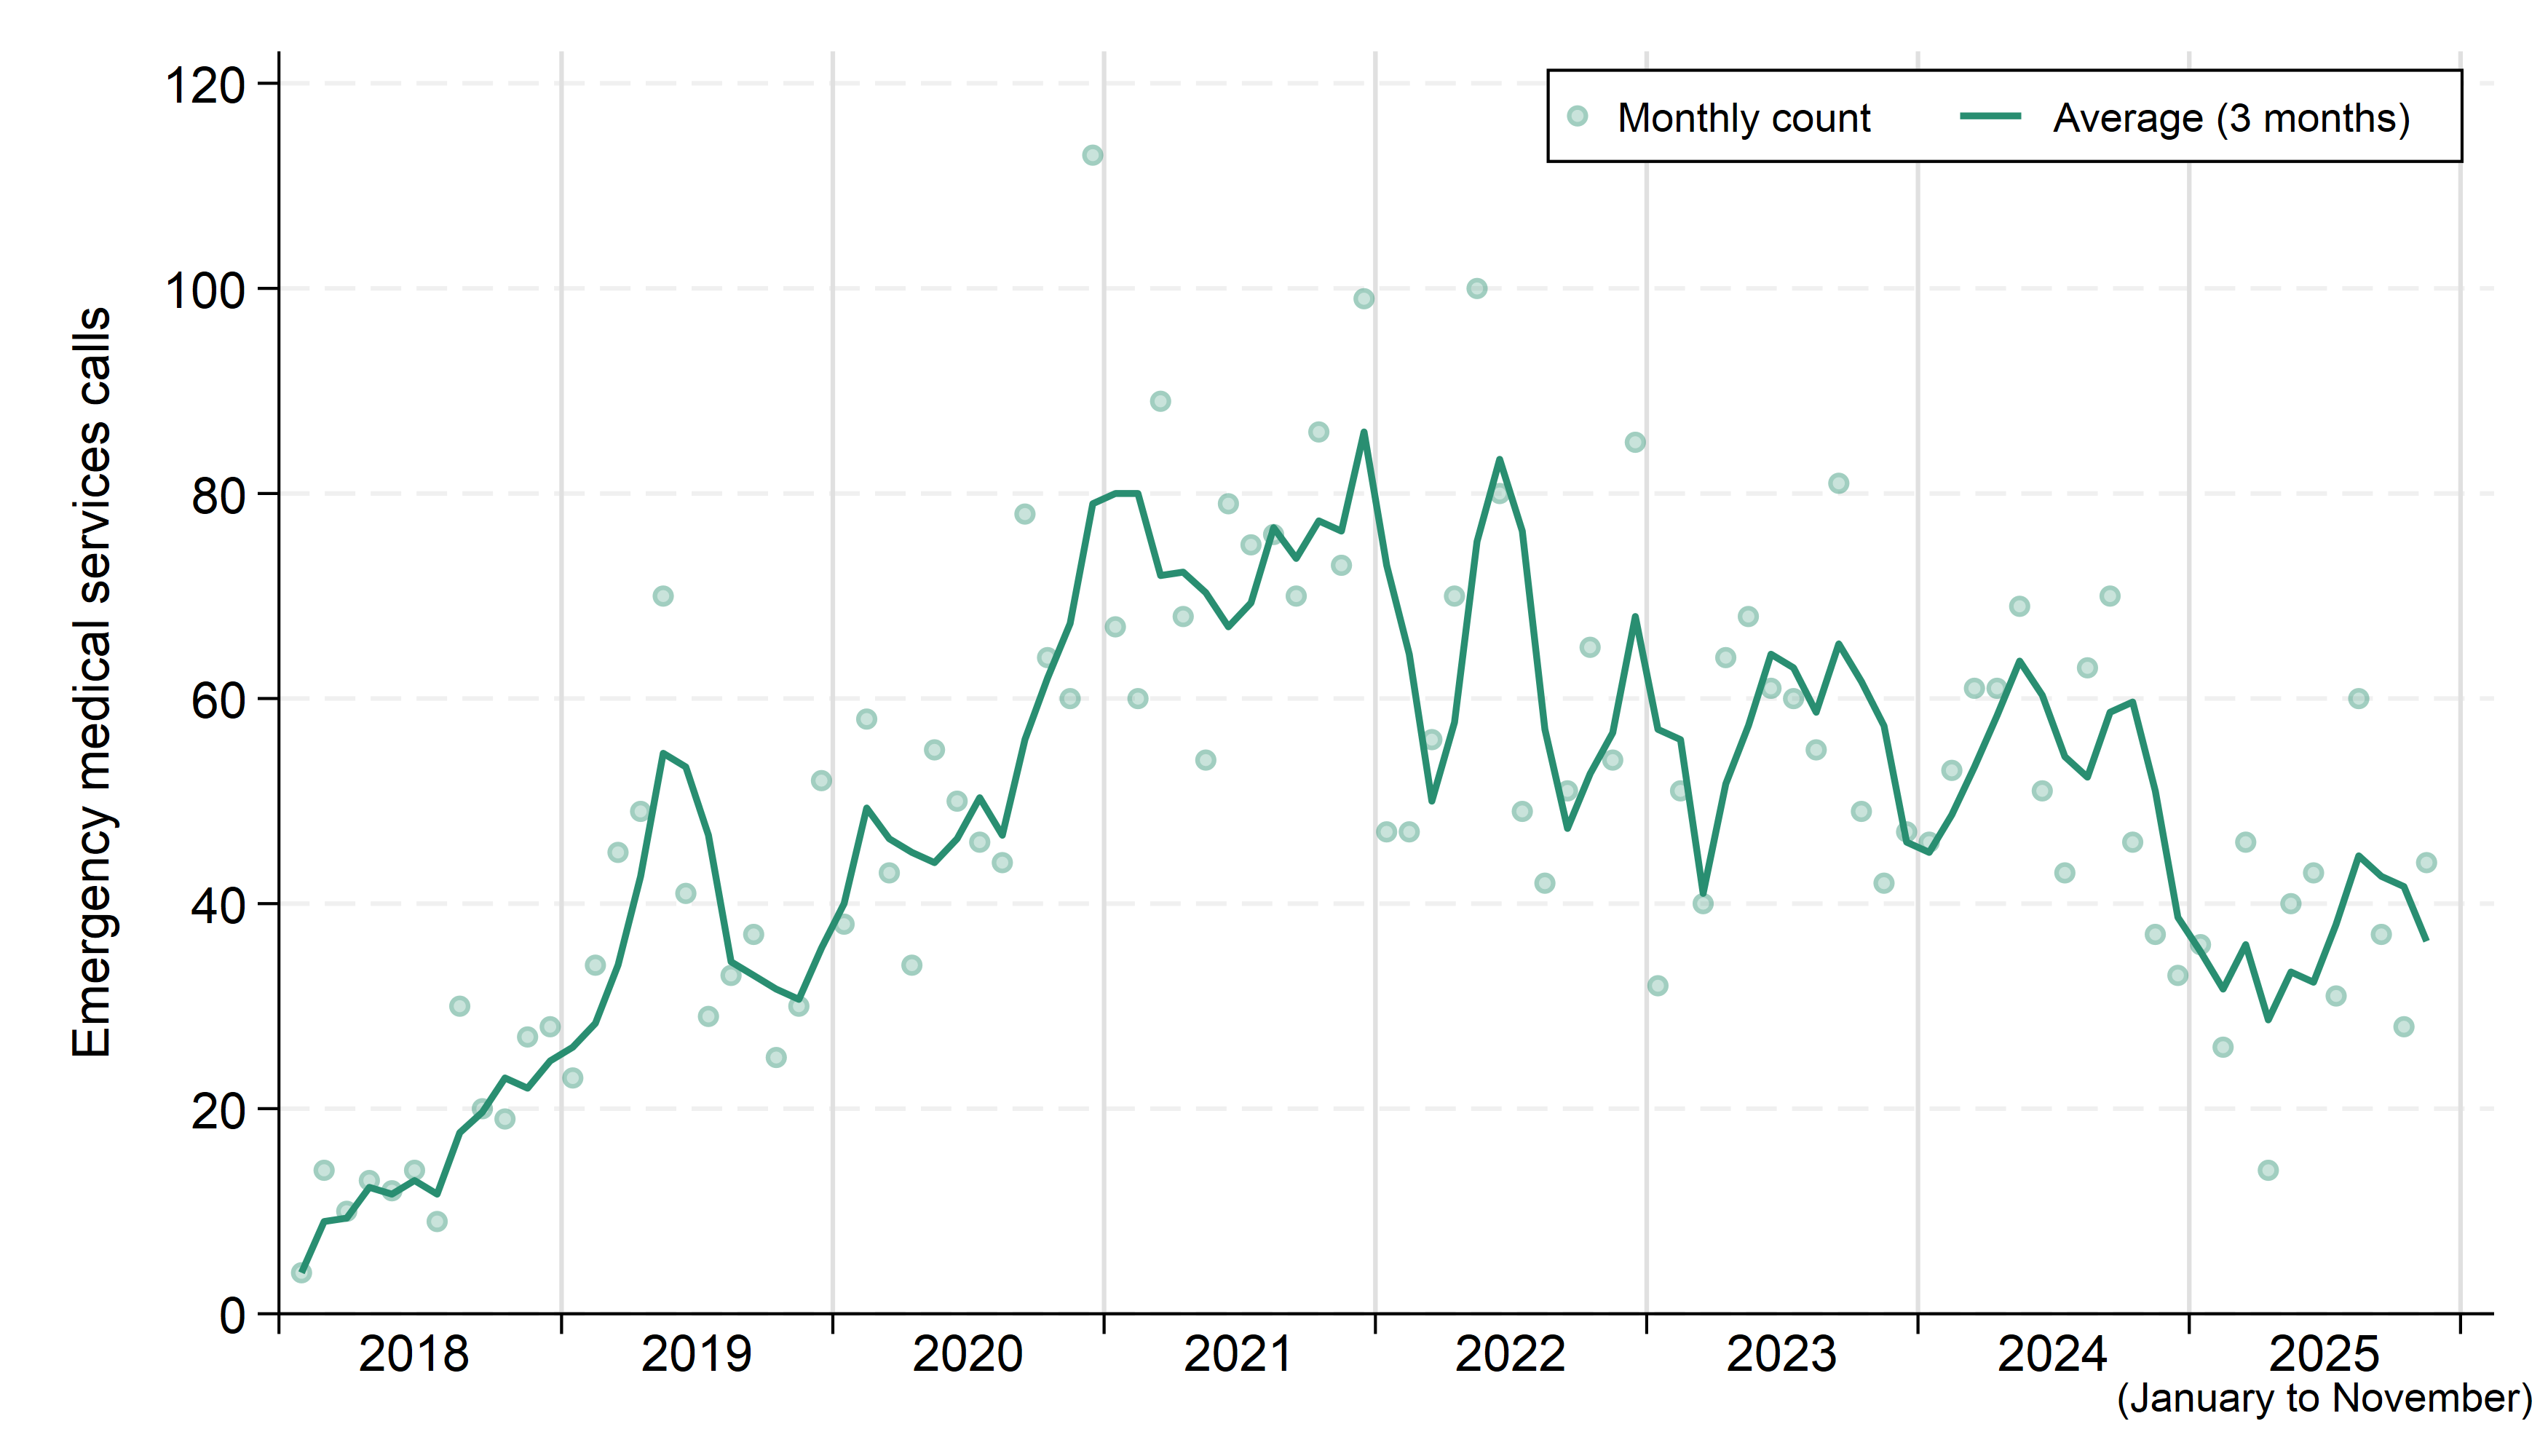
Table: Greater Sudbury Paramedic Services calls for suspected opioid-related incidents, by month, 2018–2025
| Month | 2018 | 2019 | 2020 | 2021 | 2022 | 2023 | 2024 | 2025 |
|---|---|---|---|---|---|---|---|---|
| January | 4 | 23 | 38 | 67 | 47 | 32 | 46 | 36 |
| February | 14 | 34 | 58 | 60 | 47 | 51 | 53 | 26 |
| March | 10 | 45 | 43 | 89 | 56 | 40 | 61 | 46 |
| April | 13 | 49 | 34 | 68 | 70 | 64 | 61 | 14 |
| May | 12 | 70 | 55 | 54 | 100 | 68 | 69 | 40 |
| June | 14 | 41 | 50 | 79 | 80 | 61 | 51 | 43 |
| July | 9 | 29 | 46 | 75 | 49 | 60 | 43 | 31 |
| August | 30 | 33 | 44 | 76 | 42 | 55 | 63 | 60 |
| September | 20 | 37 | 78 | 70 | 51 | 81 | 70 | 37 |
| October | 19 | 25 | 64 | 86 | 65 | 49 | 46 | 28 |
| November | 27 | 30 | 60 | 73 | 54 | 42 | 37 | 44 |
| December | 28 | 52 | 113 | 99 | 85 | 47 | 33 | - |
| TOTAL | 200 | 468 | 683 | 896 | 746 | 650 | 633 | 405 |
Note:
- Counts, especially those from recent months, are preliminary and subject to change.
- These data include cases where the responding paramedic suspects opioid involvement. This may differ from the final diagnosis or cause of death.
- These data only include instances in which 911 was called and thus are only an estimate of the total number of opioid-related drug poisonings in the community.
Source: Greater Sudbury Paramedic Services, December 17, 2025.
This item was last modified on January 6, 2026