
Naloxone distribution
Figure: Naloxone doses distributed, by month and distributor, Sudbury and Manitoulin districts, 2018–2026
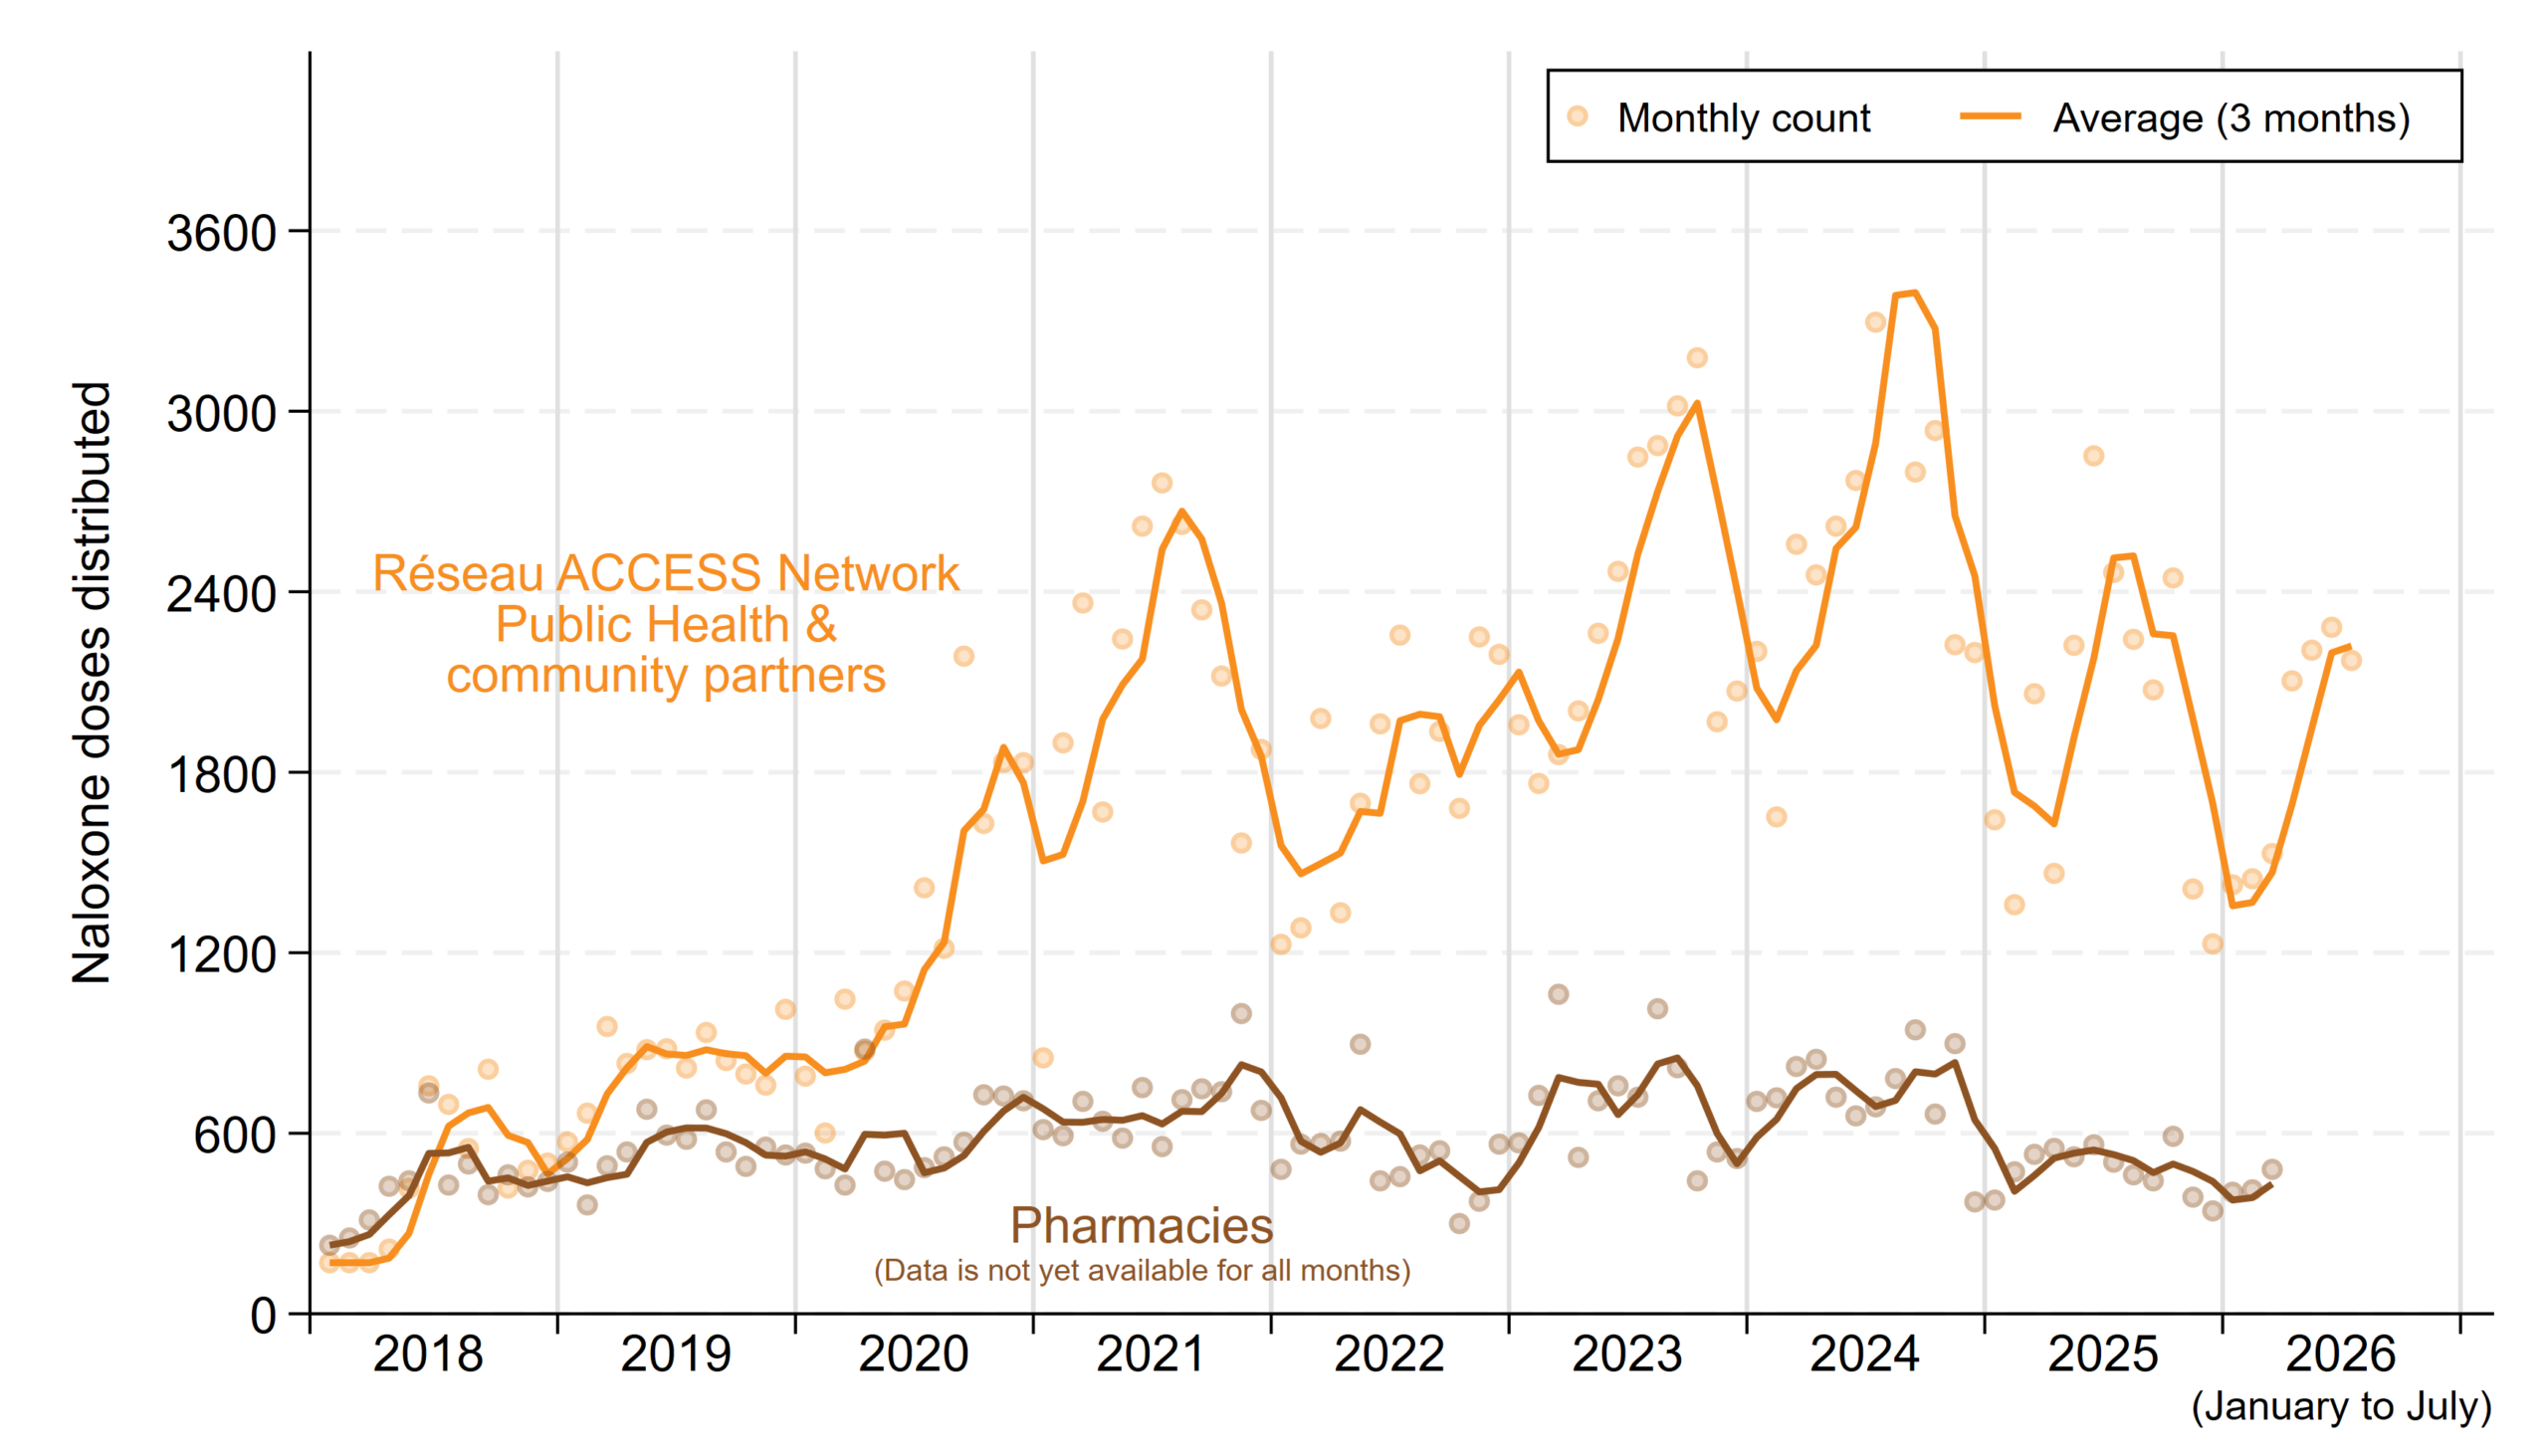
Table: Naloxone doses distributed by Réseau ACCESS Network, Public Health and community partners (excluding pharmacies), by month, Sudbury and Manitoulin districts, 2018–2026
| Month | 2018 | 2019 | 2020 | 2021 | 2022 | 2023 | 2024 | 2025 | 2026 |
|---|---|---|---|---|---|---|---|---|---|
| January | 170 | 571 | 790 | 851 | 1 228 | 1 958 | 2 202 | 1 642 | 1 426 |
| February | 170 | 667 | 601 | 1 898 | 1 283 | 1 763 | 1 652 | 1 360 | 1 446 |
| March | 170 | 955 | 1 046 | 2 363 | 1 979 | 1 859 | 2 558 | 2 061 | 1 530 |
| April | 215 | 832 | 873 | 1 668 | 1 333 | 2 004 | 2 456 | 1 464 | 2 104 |
| May | 417 | 878 | 943 | 2 243 | 1 697 | 2 262 | 2 618 | 2 222 | 2 206 |
| June | 758 | 881 | 1 073 | 2 618 | 1 961 | 2 468 | 2 770 | 2 852 | 2 282 |
| July | 696 | 817 | 1 416 | 2 762 | 2 256 | 2 848 | 3 296 | 2 464 | 2 172 |
| August | 549 | 935 | 1 215 | 2 624 | 1 762 | 2 886 | 4 090 | 2 242 | - |
| September | 813 | 842 | 2 186 | 2 340 | 1 936 | 3 018 | 2 798 | 2 074 | - |
| October | 418 | 797 | 1 630 | 2 120 | 1 680 | 3 178 | 2 936 | 2 446 | - |
| November | 477 | 760 | 1 833 | 1 565 | 2 250 | 1 968 | 2 224 | 1 412 | - |
| December | 501 | 1 012 | 1 832 | 1 876 | 2 192 | 2 070 | 2 198 | 1 230 | - |
| TOTAL | 5 354 | 9 947 | 15 438 | 24 928 | 21 557 | 28 282 | 31 798 | 23 469 | 13 166 |
Table: Naloxone doses distributed by pharmacies, by month, Sudbury and Manitoulin districts, 2018–2026
| Month | 2018 | 2019 | 2020 | 2021 | 2022 | 2023 | 2024 | 2025 | 2026 |
|---|---|---|---|---|---|---|---|---|---|
| January | 228 | 504 | 534 | 612 | 480 | 568 | 706 | 378 | 404 |
| February | 252 | 362 | 482 | 592 | 564 | 726 | 718 | 472 | 412 |
| March | 312 | 492 | 428 | 706 | 566 | 1 062 | 822 | 530 | 480 |
| April | 424 | 538 | 880 | 640 | 574 | 520 | 846 | 550 | - |
| May | 442 | 680 | 474 | 584 | 896 | 708 | 720 | 522 | - |
| June | 734 | 594 | 446 | 752 | 442 | 758 | 658 | 562 | - |
| July | 428 | 580 | 486 | 556 | 456 | 720 | 688 | 504 | - |
| August | 498 | 678 | 522 | 712 | 528 | 1 014 | 782 | 462 | - |
| September | 396 | 538 | 570 | 748 | 542 | 818 | 944 | 442 | - |
| October | 462 | 490 | 728 | 738 | 300 | 442 | 664 | 590 | - |
| November | 422 | 554 | 724 | 998 | 374 | 538 | 898 | 388 | - |
| December | 440 | 528 | 708 | 676 | 564 | 516 | 372 | 342 | - |
| TOTAL | 5 038 | 6 538 | 6 982 | 8 314 | 6 286 | 8 390 | 8 818 | 5 742 | 1 296 |
Note:
- Counts, especially those from recent months, are preliminary and subject to change.
- Pharmacy data are not yet available for recent months.
- Data on counts of doses distributed by the Réseau ACCESS Network were only available by quarter from January 2018 to June 2019. These quarterly counts are assumed here to have been distributed equally in across the 3 months comprising each quarter in that period.
Sources: 1) Public Health Sudbury & Districts naloxone distribution program data [unpublished], accessed August 7, 2026, 2) Réseau ACCESS Network naloxone distribution program data [unpublished], accessed August 7, 2026 3) Ontario Naloxone Program for Pharmacies data, Ministry of Health, received June 9, 2026.
This item was last modified on August 27, 2026